A Data Physicalization of Pittsburgh Food Rescue
Team:
Kai Zhang, Partner (Carnegie Mellon University)
Benedikt Groß, Visiting Faculty at the School of Design & The Frank-Ratchye STUDIO for Creative Inquiry (Carnegie Mellon University)
David Primm, Chief Program Officer (412 Food Rescue)
Ryan Geraghty, Product Operations Manager (412 Food Rescue)
Team:
Kai Zhang, Partner (Carnegie Mellon University)
Benedikt Groß, Visiting Faculty at the School of Design & The Frank-Ratchye STUDIO for Creative Inquiry (Carnegie Mellon University)
David Primm, Chief Program Officer (412 Food Rescue)
Ryan Geraghty, Product Operations Manager (412 Food Rescue)
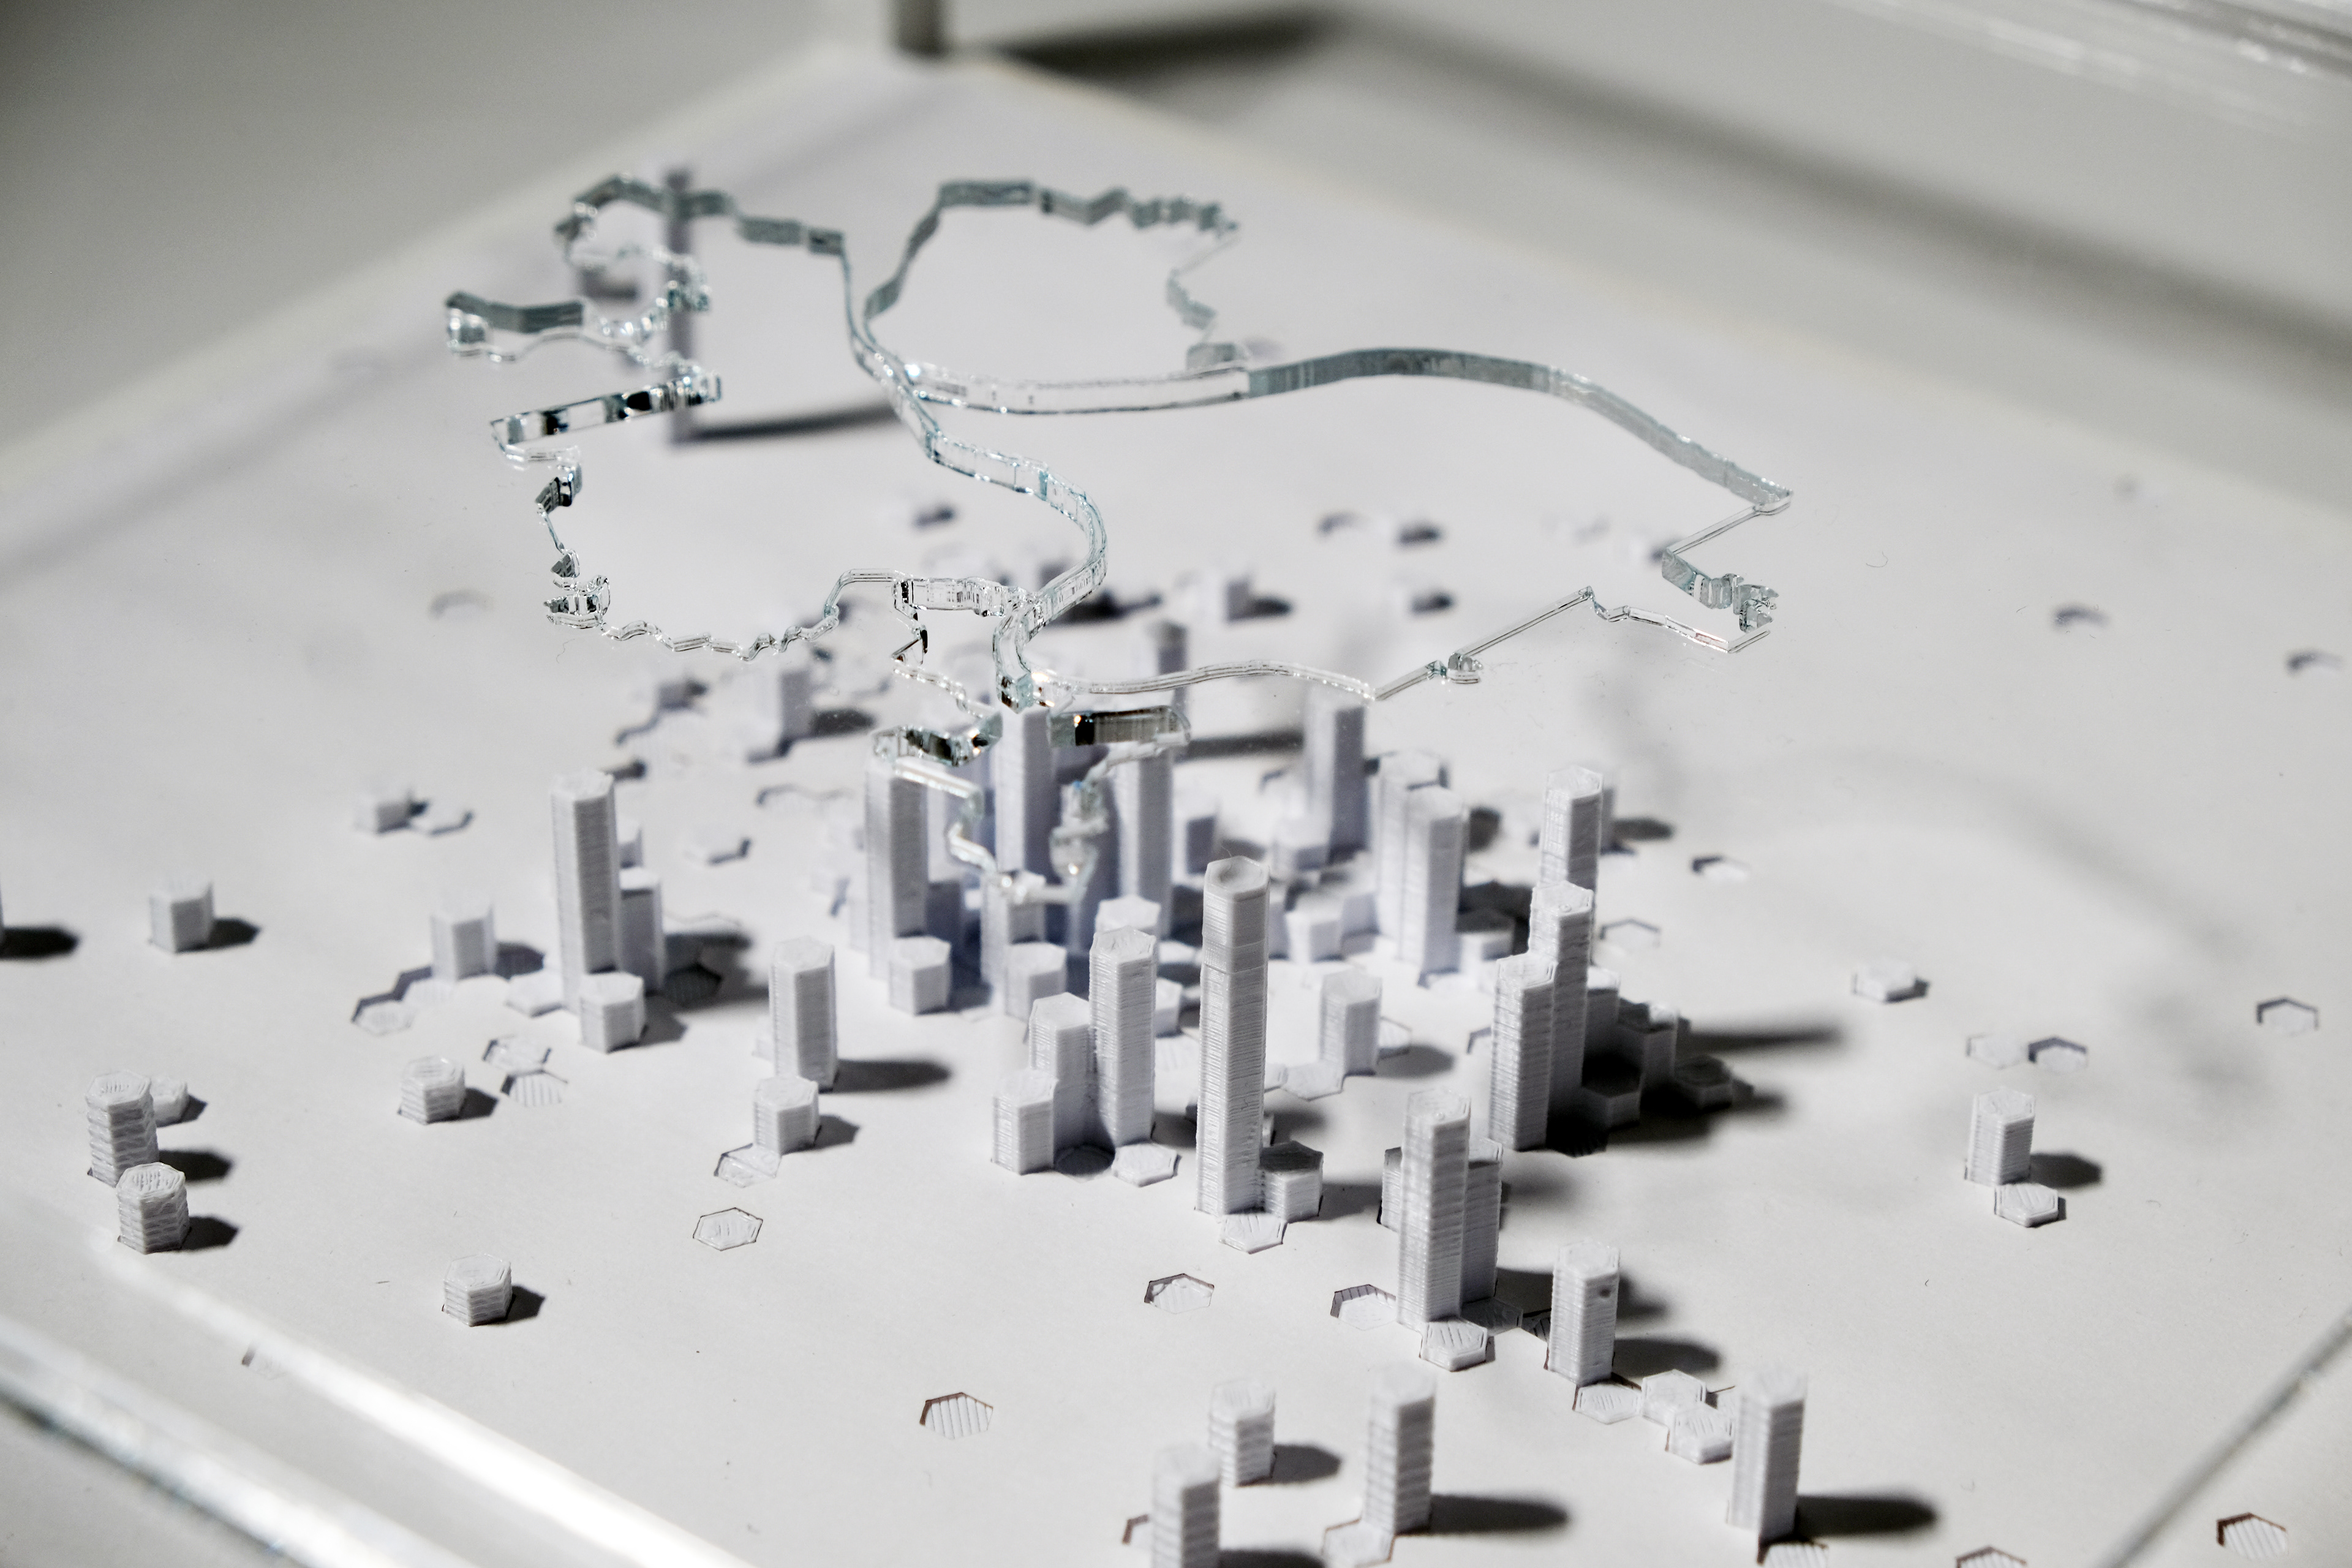
Final Model Images


Initial Goals
Our initial goals for this project during the project ideation stage was to represent or reveal the impact of an unforeseen urban system through a 3D data visualization/data physicalization project. We started broadly considering issues like water usage and waste collection which are often overlooked day-to-day. We sketched out ideas of how we might design the final product and how it might be fabricated. In parallel with this effort, we explored GIS data sets dealing with these “hidden” urban infrastructural systems and sought out organizations that might have interesting data regarding these topics. We stumbled upon the fascinating food rescue work being done at 412 Food Rescue and reached out to propose a partnership. We then met to discuss how our collaboration would work as well as what information the organization could benefit from representing in regards to how their model and work is different from other food rescue organizations in Pittsburgh.
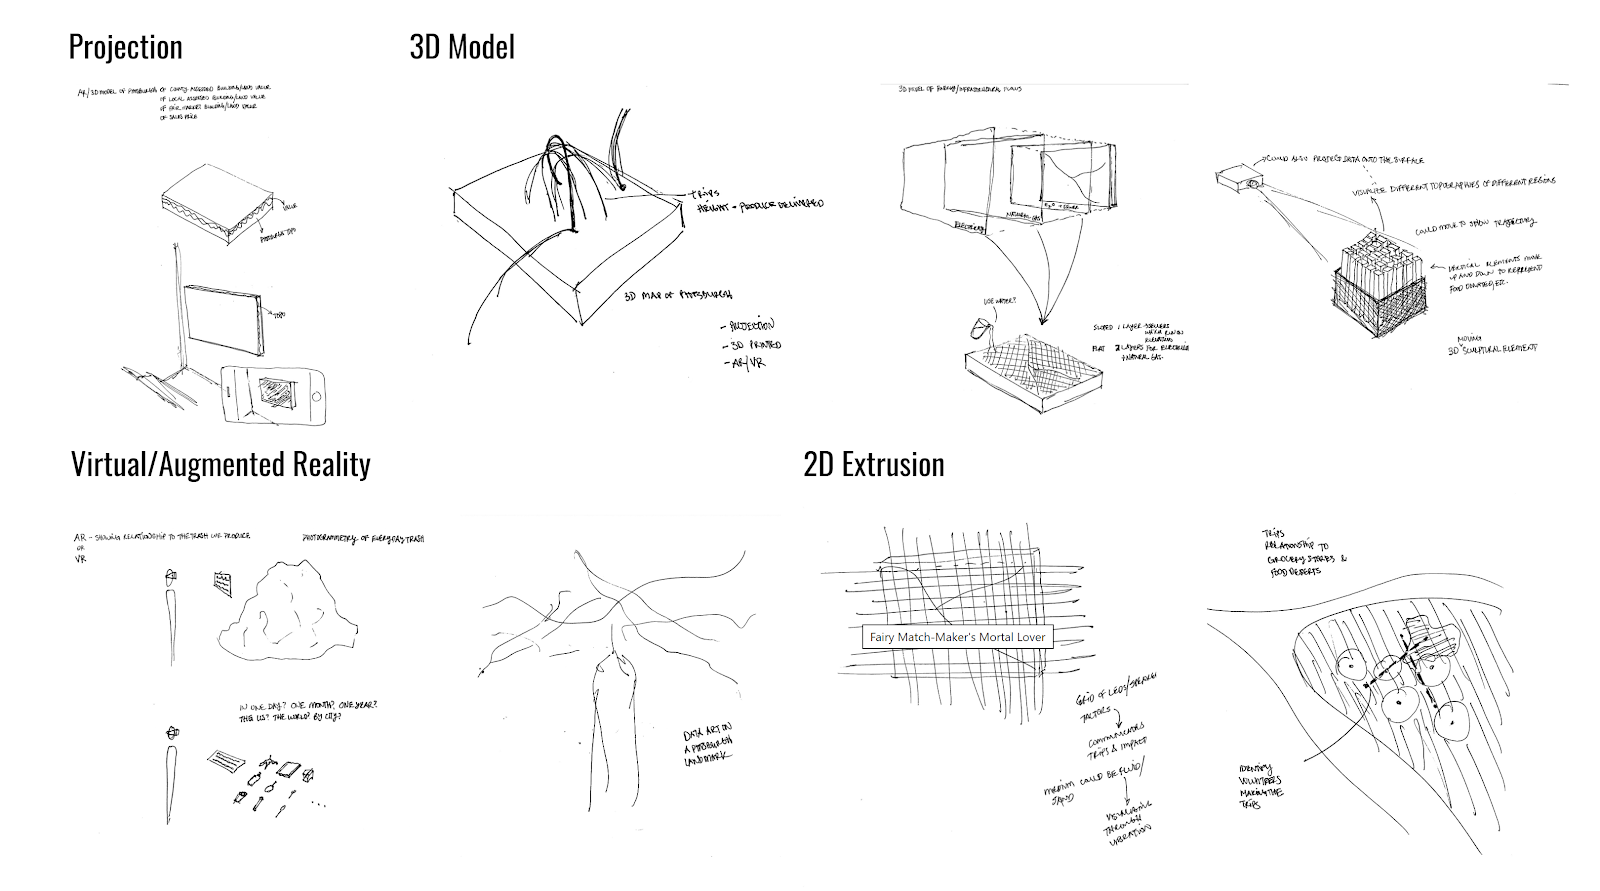
At the initial meeting, we presented our interests, case study projects that inspired us, as well as initial sketch ideas of what the final product might be.
Our initial goals for this project during the project ideation stage was to represent or reveal the impact of an unforeseen urban system through a 3D data visualization/data physicalization project. We started broadly considering issues like water usage and waste collection which are often overlooked day-to-day. We sketched out ideas of how we might design the final product and how it might be fabricated. In parallel with this effort, we explored GIS data sets dealing with these “hidden” urban infrastructural systems and sought out organizations that might have interesting data regarding these topics. We stumbled upon the fascinating food rescue work being done at 412 Food Rescue and reached out to propose a partnership. We then met to discuss how our collaboration would work as well as what information the organization could benefit from representing in regards to how their model and work is different from other food rescue organizations in Pittsburgh.
At the initial meeting, we presented our interests, case study projects that inspired us, as well as initial sketch ideas of what the final product might be.
Precedents & Initial Sketches
Income Inequality by Herwig Scherabon
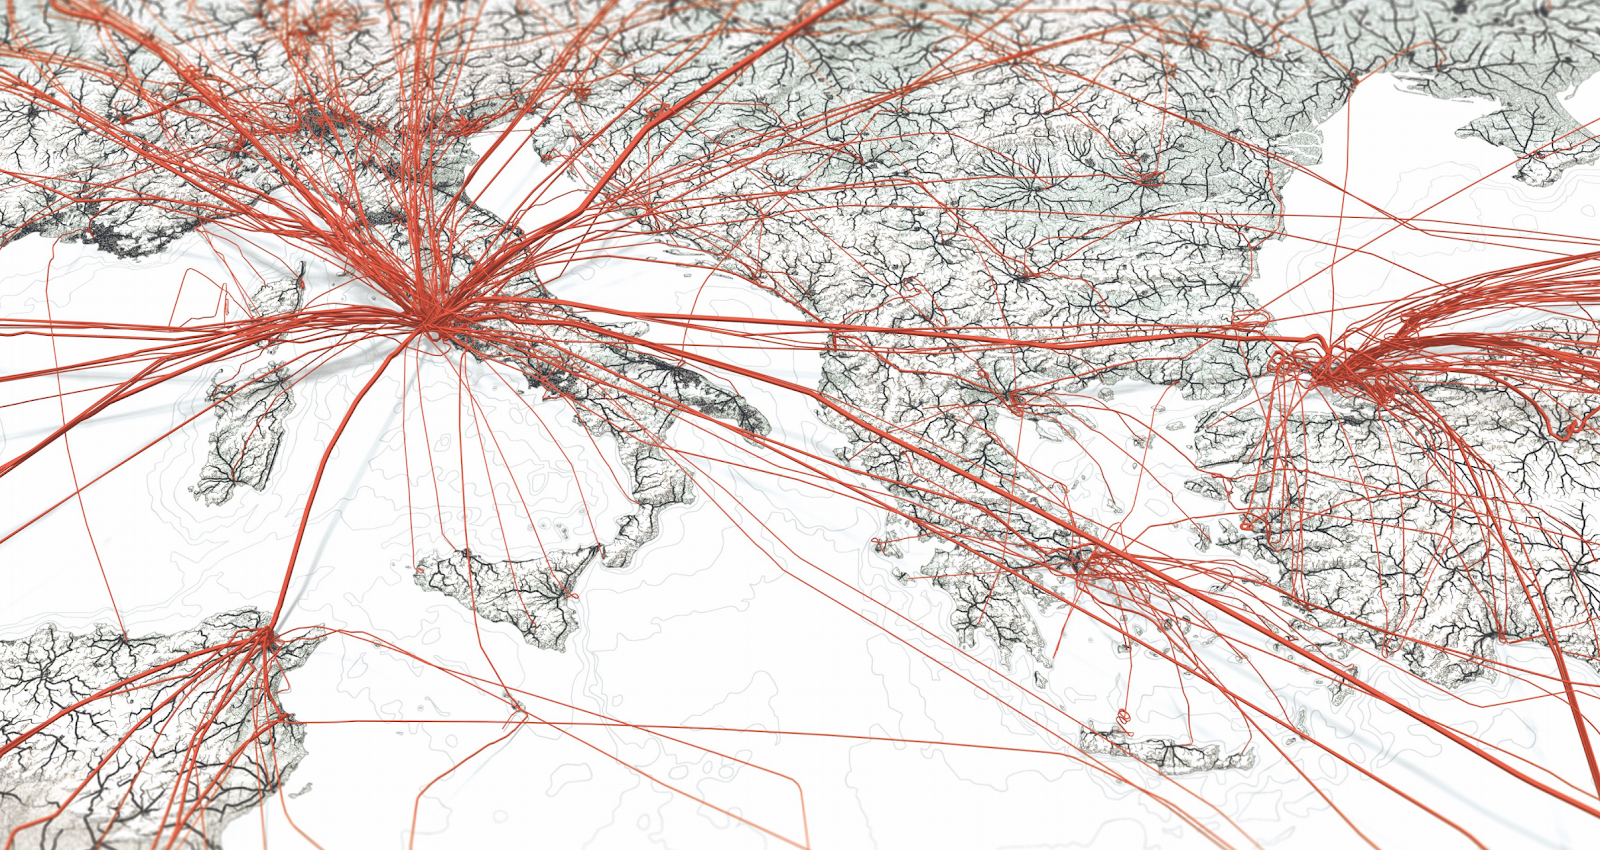
Roads to Rome by Benedikt Groß
Trajectories by Benedikt Groß
We went in with the desire to advocate for the work that 412 Food Rescue does by using our skills in digital fabrication to appeal to the CMU and broader population. Also, more generally, we wanted to spread awareness about issues of waste and the work that is already being done to combat not only food waste, but also issues of accessibility to food in Pittsburgh. Ultimately, to achieve our goals, we needed to perform an analysis of the data that 412 Food Rescue collects to draw meaningful conclusions and attract attention to the organization’s efforts.
Partnership
412 Food Rescue is a non-profit organization founded as a direct response to the disconnect between food waste, hunger, and environmental sustainability. It works with food retailers to prevent surplus food from going to waste by directly transferring food to nonprofit partners that serve those who are food insecure. In order to facilitate these connections and relationships, 412 Food rescue created an end-to-end technology platform that matches food donations to the appropriate nonprofits, connects food rescue heroes to these organizations, and organizes these missions. In addition to these functions, 412 Food Rescue also trains volunteers on food safety and tracks data and analytics to measure their impact on hunger and the environment, making them a perfect partner with which to engage in this effort.
For 412 Food Rescue, their goals were to tell the story of their impact and portray what sets them apart from other food rescue organizations.
To do so, we decided to look at the difference between the transportation types that were applied by their model. Although their data included transportation means of all sorts, from bicycles and walking, to large trucks and Zipcars, we decided to distinguish two categories, the large scheduled truck deliveries that are managed by 412 Food Rescue, and the individual civic contribution of volunteers which is more sporadic, but just as critical to the success of the organization and its food rescue model. Lastly, we wanted to overlay the work that 412 Food Rescue does with existing data dealing with food and transit deserts in Pittsburgh to represent the lack of access to fresh produce of communities and the reasoning behind the organizations’ new directions and targeted initiatives.
Design Process
Our first step, after discussing the project, was to decide what data we would need to engage the project. Because 412 Food Rescue utilizes a relational structure to store their data, we filtered through the hundreds of data lists to find the specific data sets that we could directly apply to this project. The initial data that we selected dealt with the type of vehicle used, the date of the rescue, and the rescue pick-up and drop-off location. With this information, we were able to then begin the process of data parsing through Grasshopper, a plug-in of Rhinoceros (a 3D modeling software), which would allow us to connect the data straight into a modeling pipeline to make the process more efficient and accurate. We explored a couple of ideas regarding how the data might be represented, from bundling to hex-binning and beyond, we worked through abstracting the data to be more manageable and feasible for us to represent in 3D.
Our first step, after discussing the project, was to decide what data we would need to engage the project. Because 412 Food Rescue utilizes a relational structure to store their data, we filtered through the hundreds of data lists to find the specific data sets that we could directly apply to this project. The initial data that we selected dealt with the type of vehicle used, the date of the rescue, and the rescue pick-up and drop-off location. With this information, we were able to then begin the process of data parsing through Grasshopper, a plug-in of Rhinoceros (a 3D modeling software), which would allow us to connect the data straight into a modeling pipeline to make the process more efficient and accurate. We explored a couple of ideas regarding how the data might be represented, from bundling to hex-binning and beyond, we worked through abstracting the data to be more manageable and feasible for us to represent in 3D.
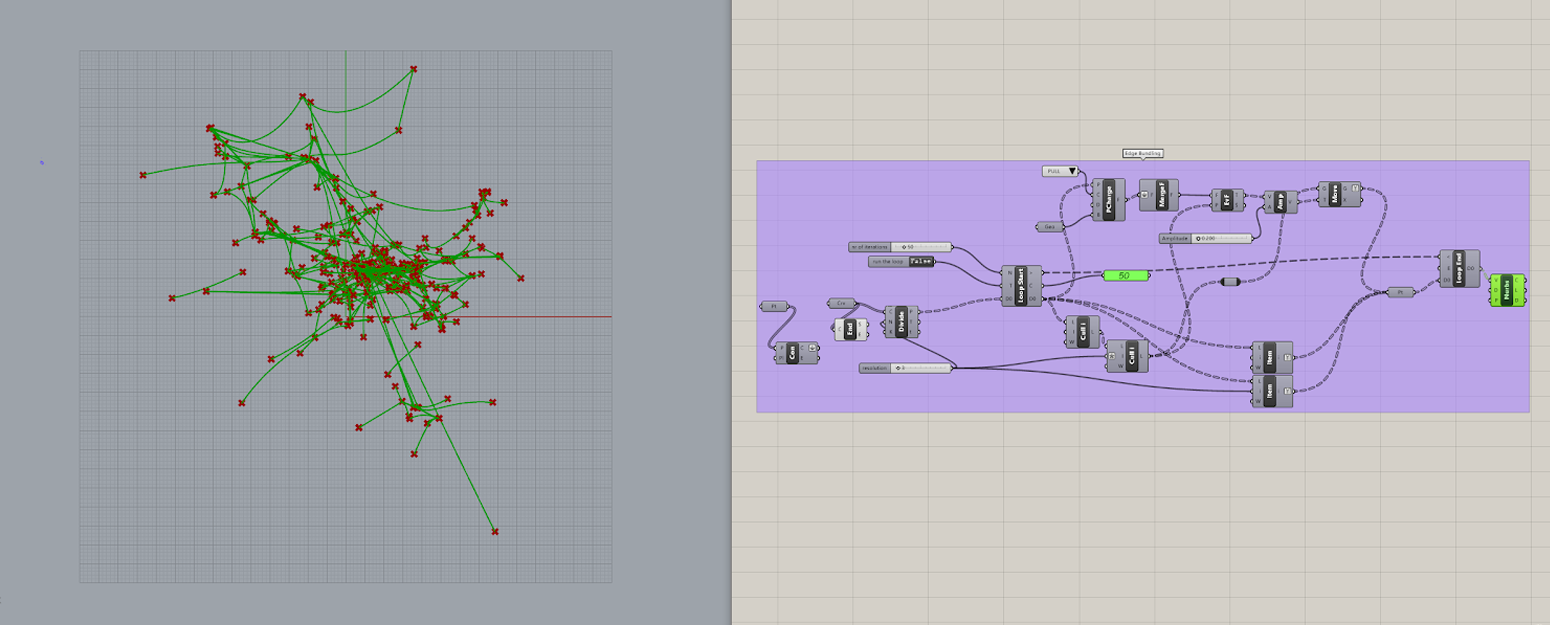
Route Bundling
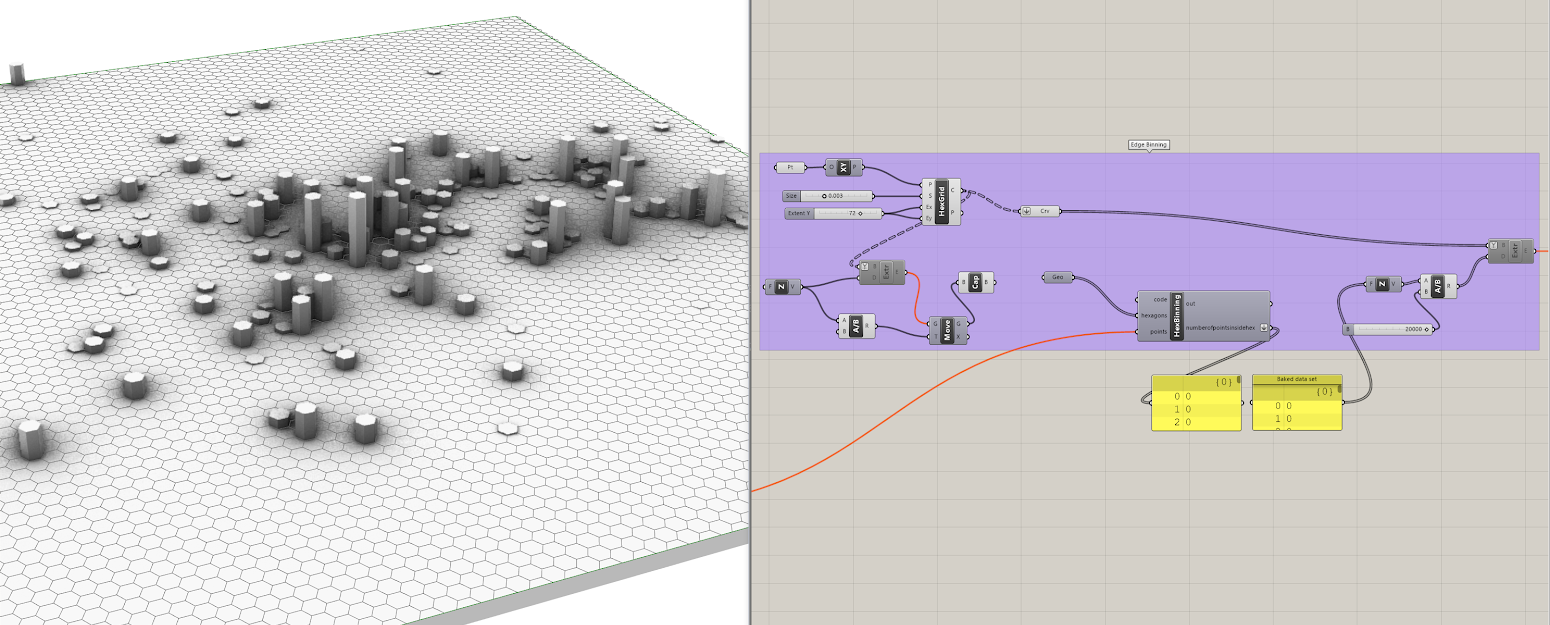
Edge Binning
Although we had originally had considered engaging with architectural robotics, 3D printing, and other digital fabrication methods, we decided to focus on representing the data through more controlled laser cutting and smaller scale 3D printing strategies due to the time constraints of the project and the complexity of the layered data. As such, we recalibrated the scope of the project and confirmed with 412 Food Rescue the final proposal for the project.
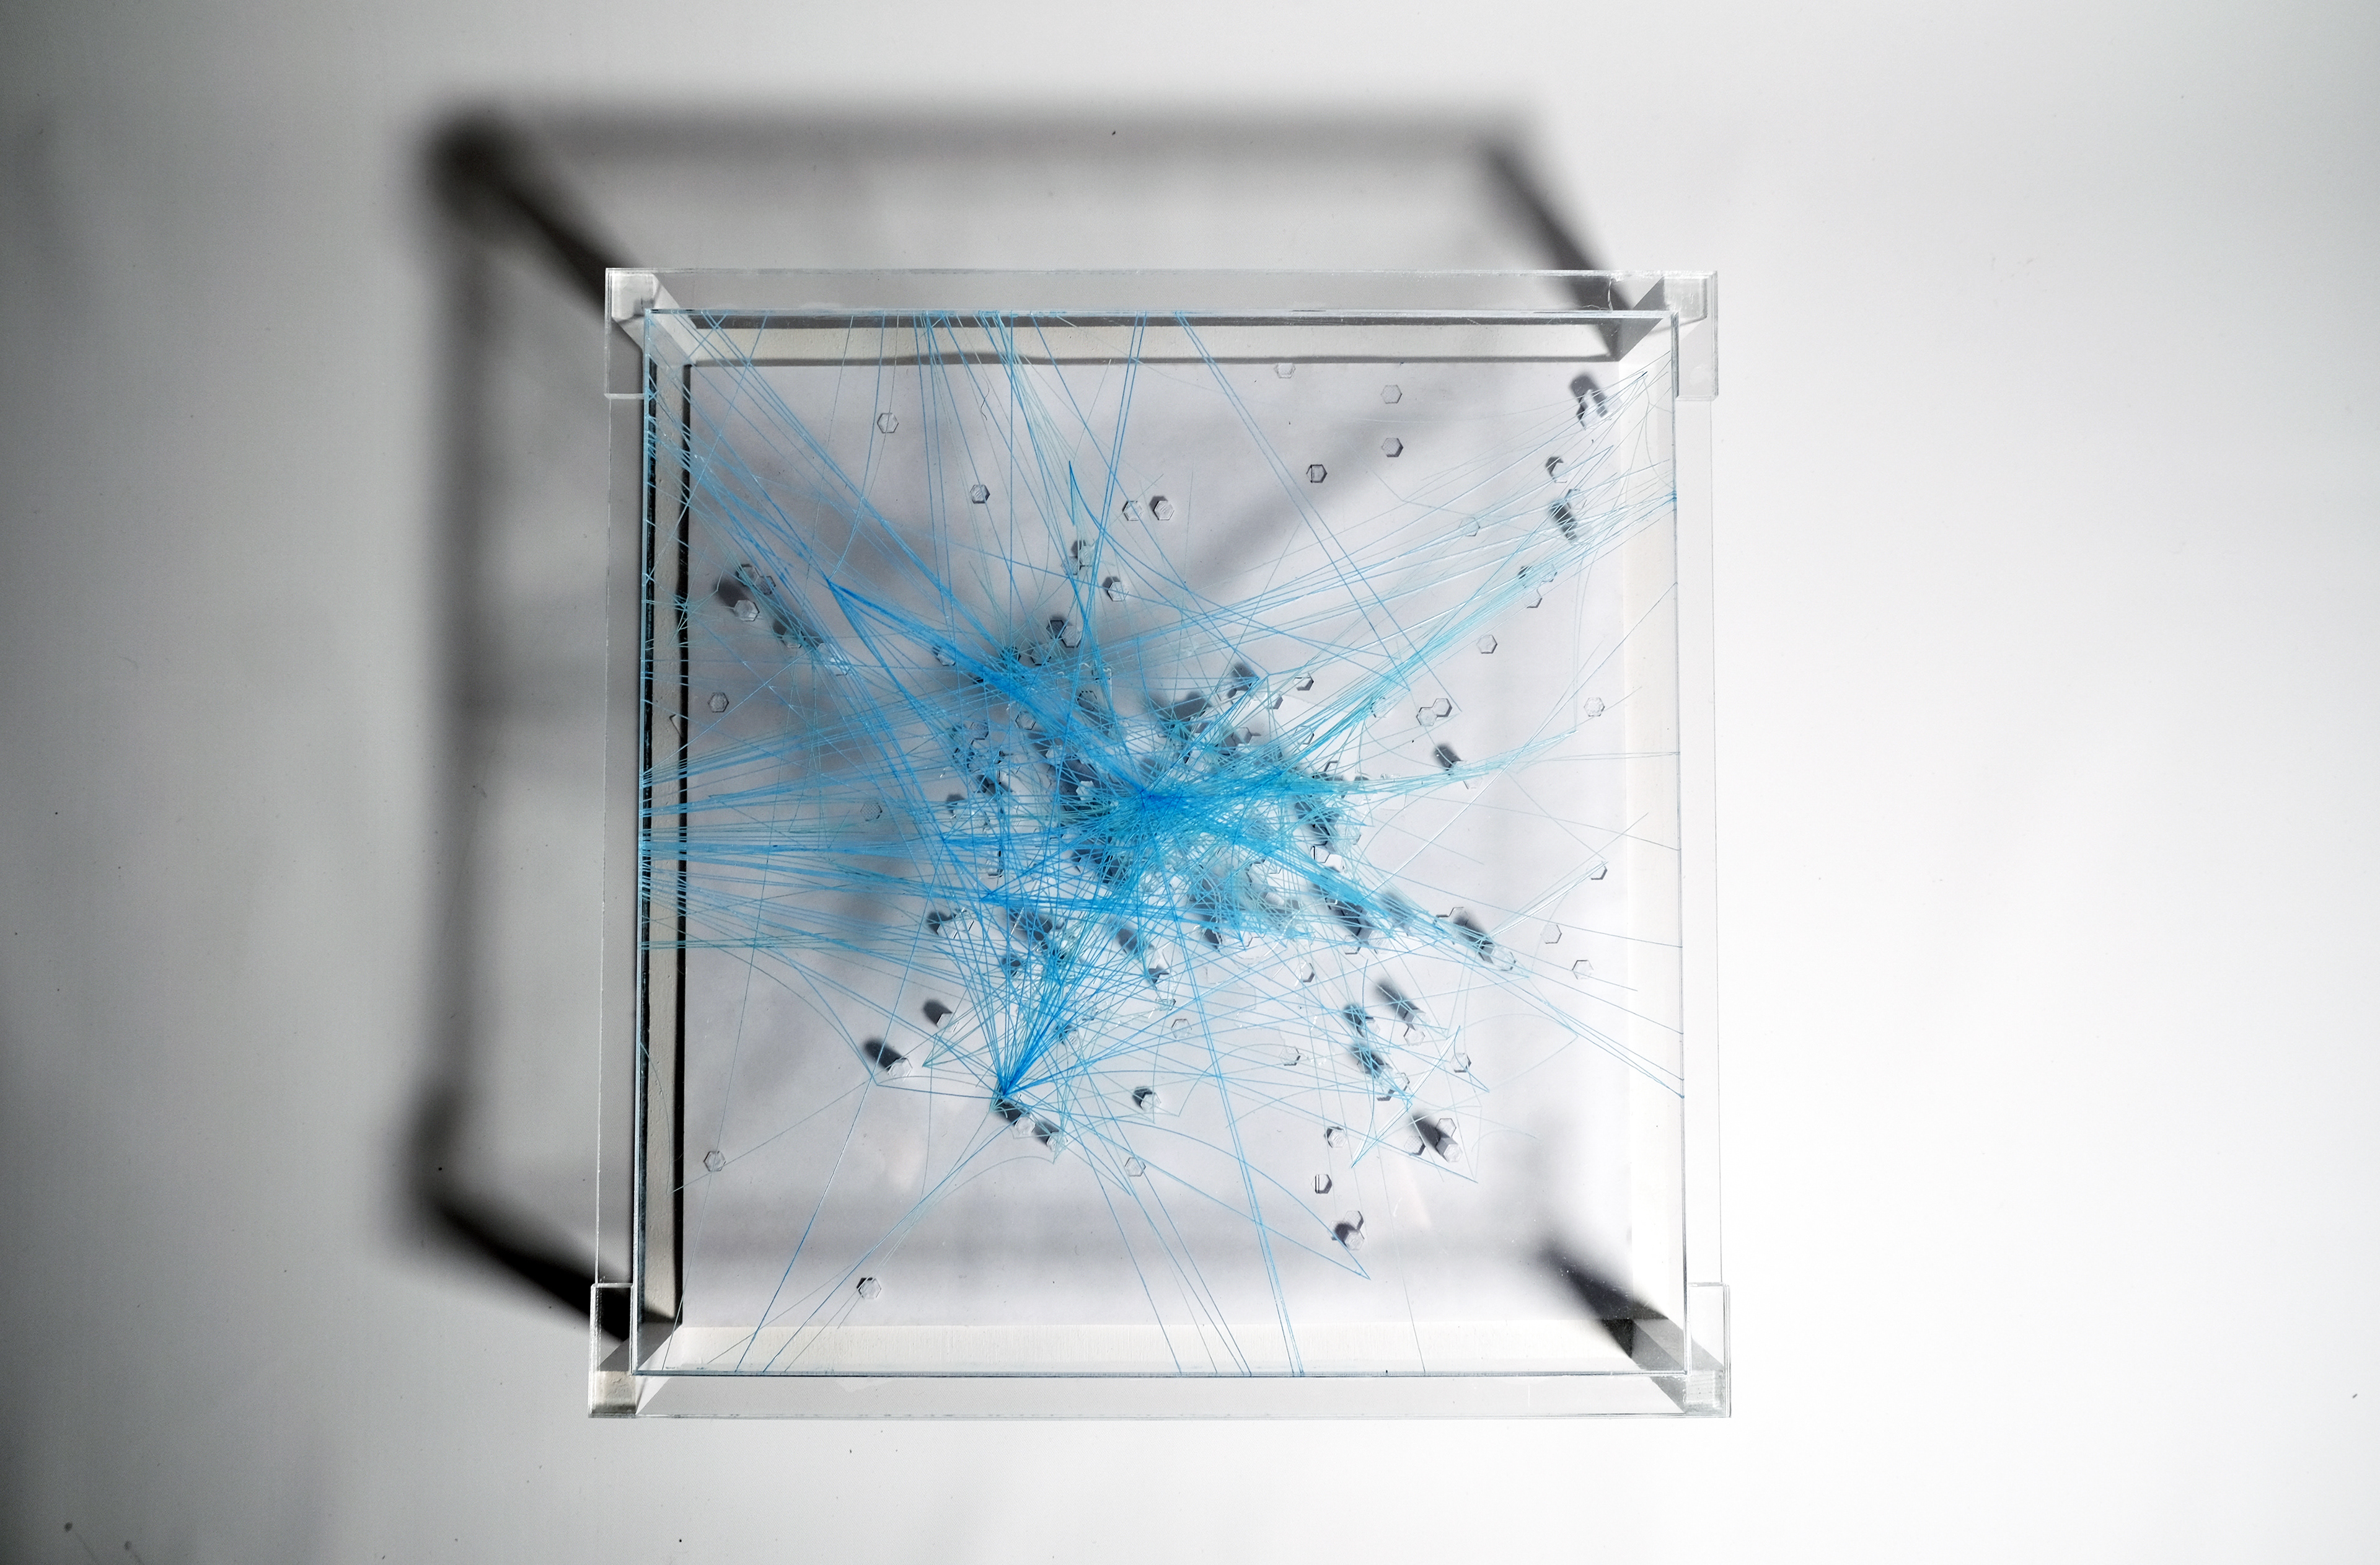
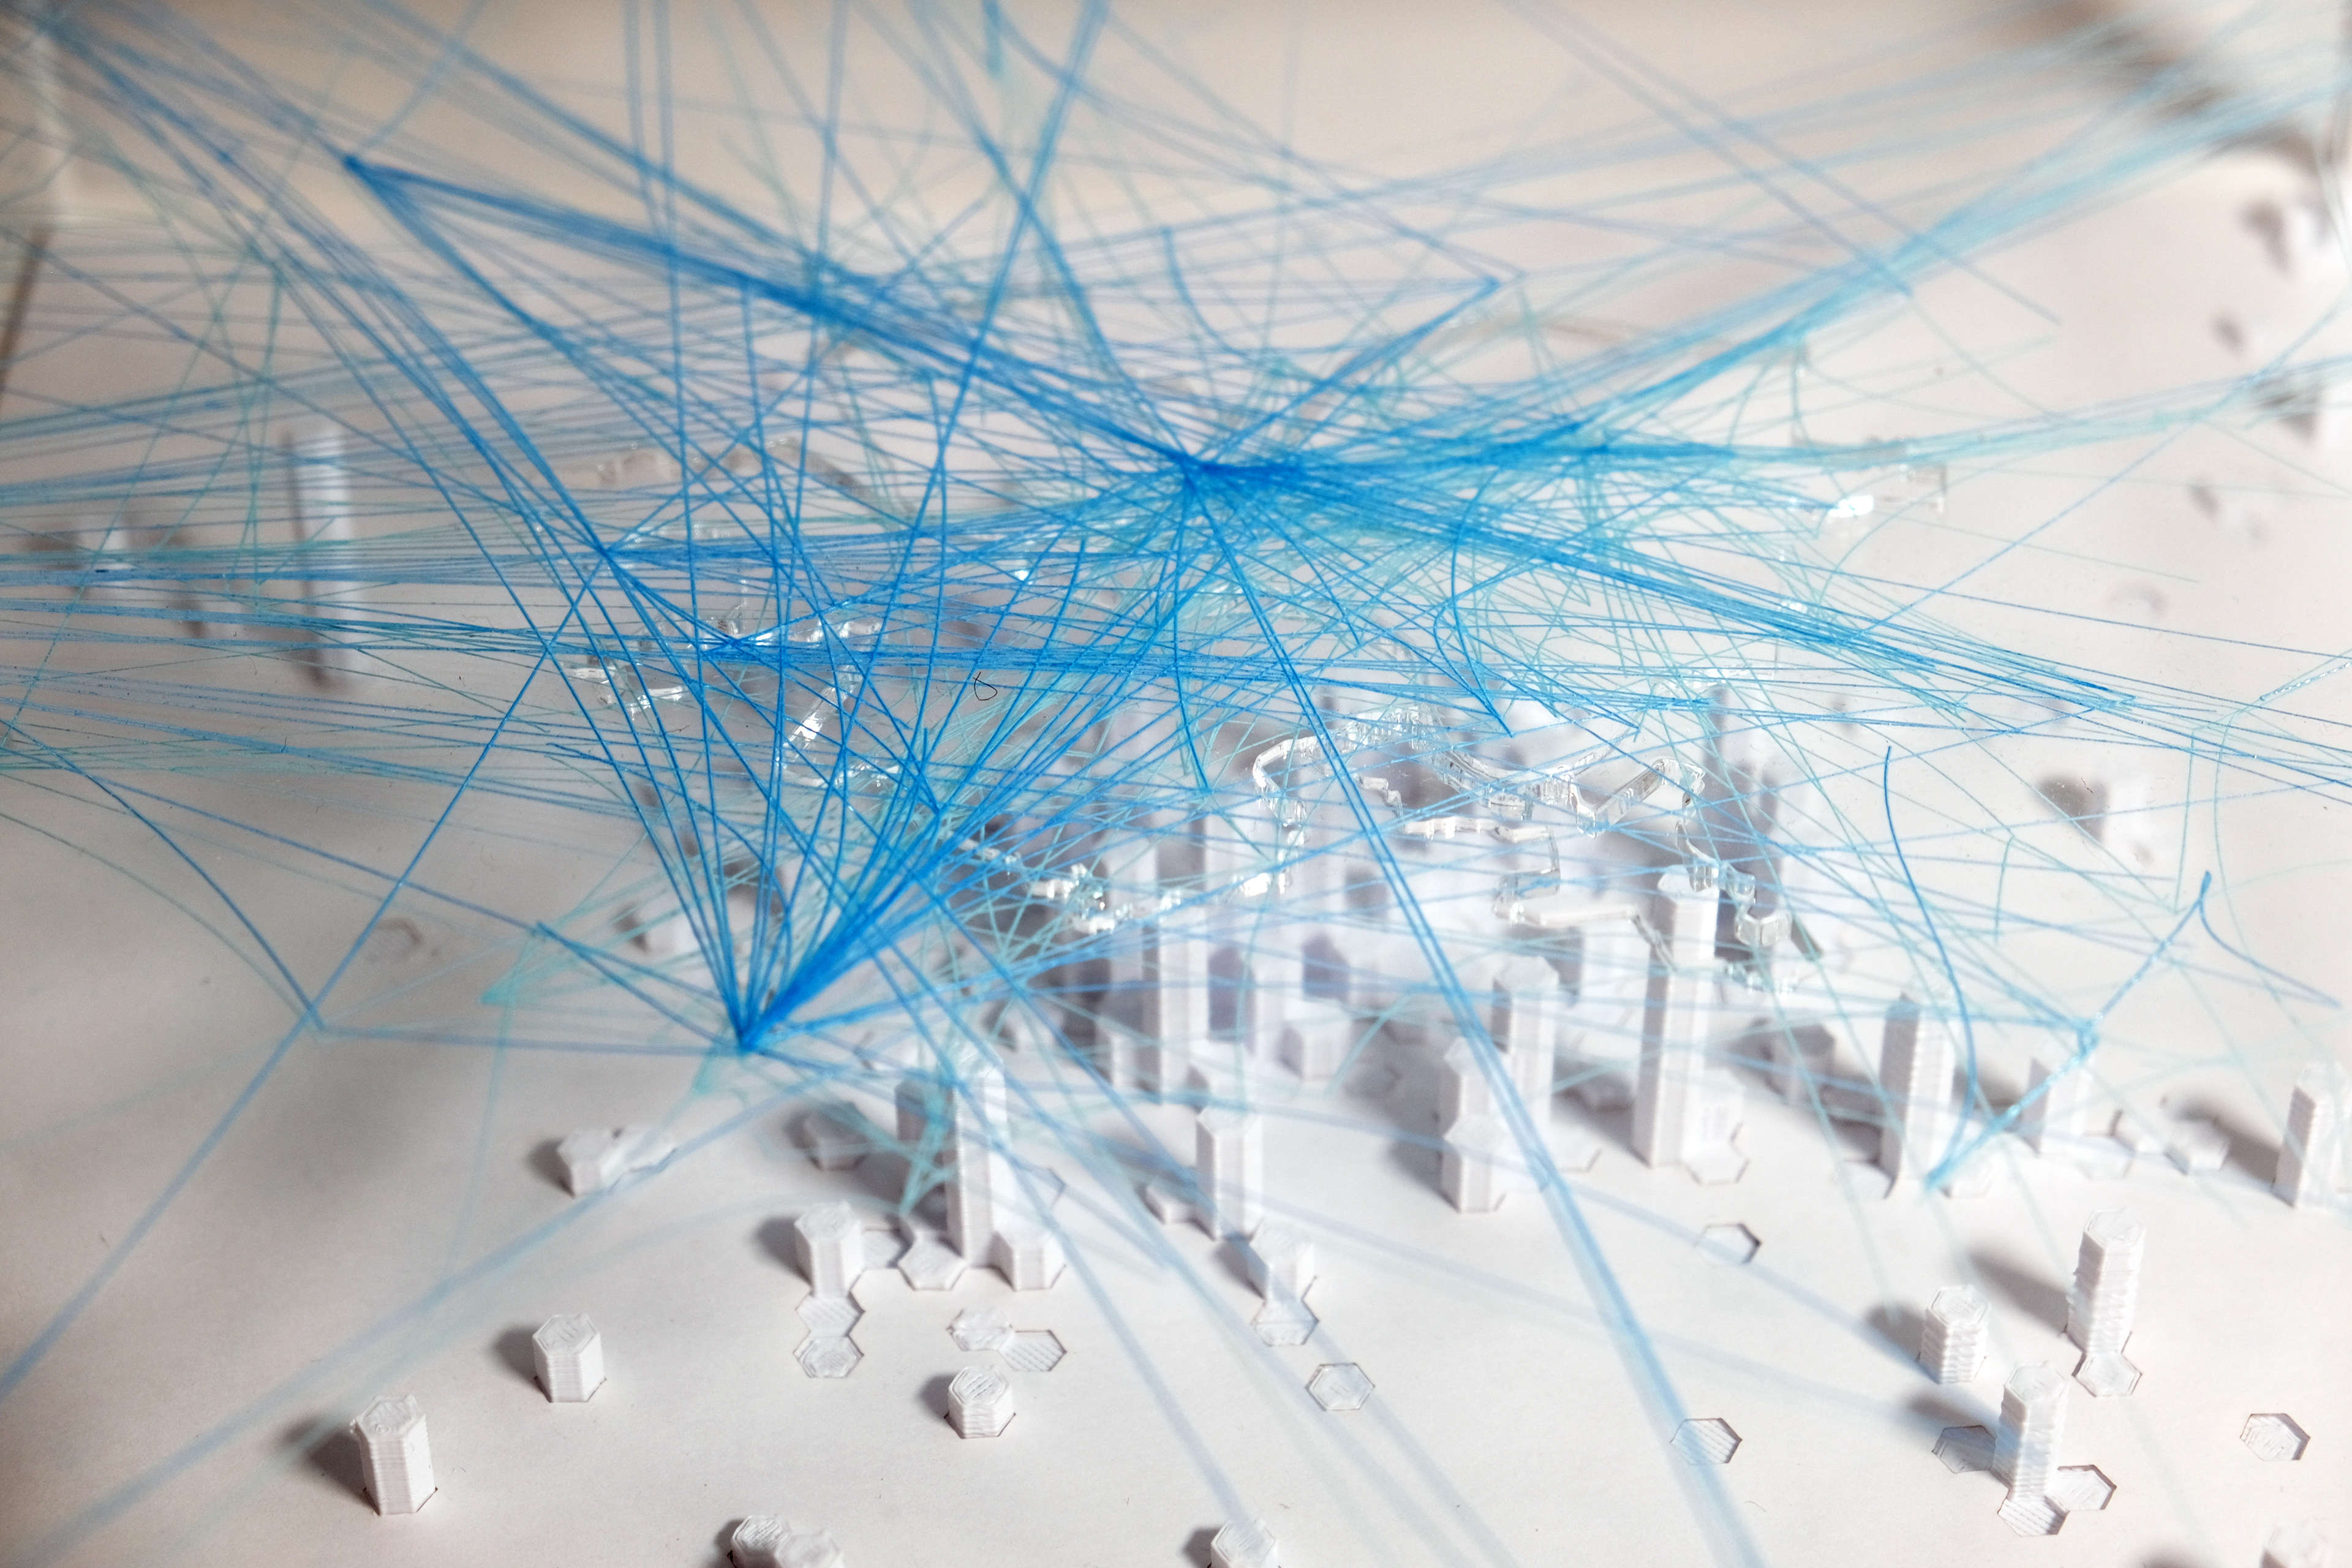
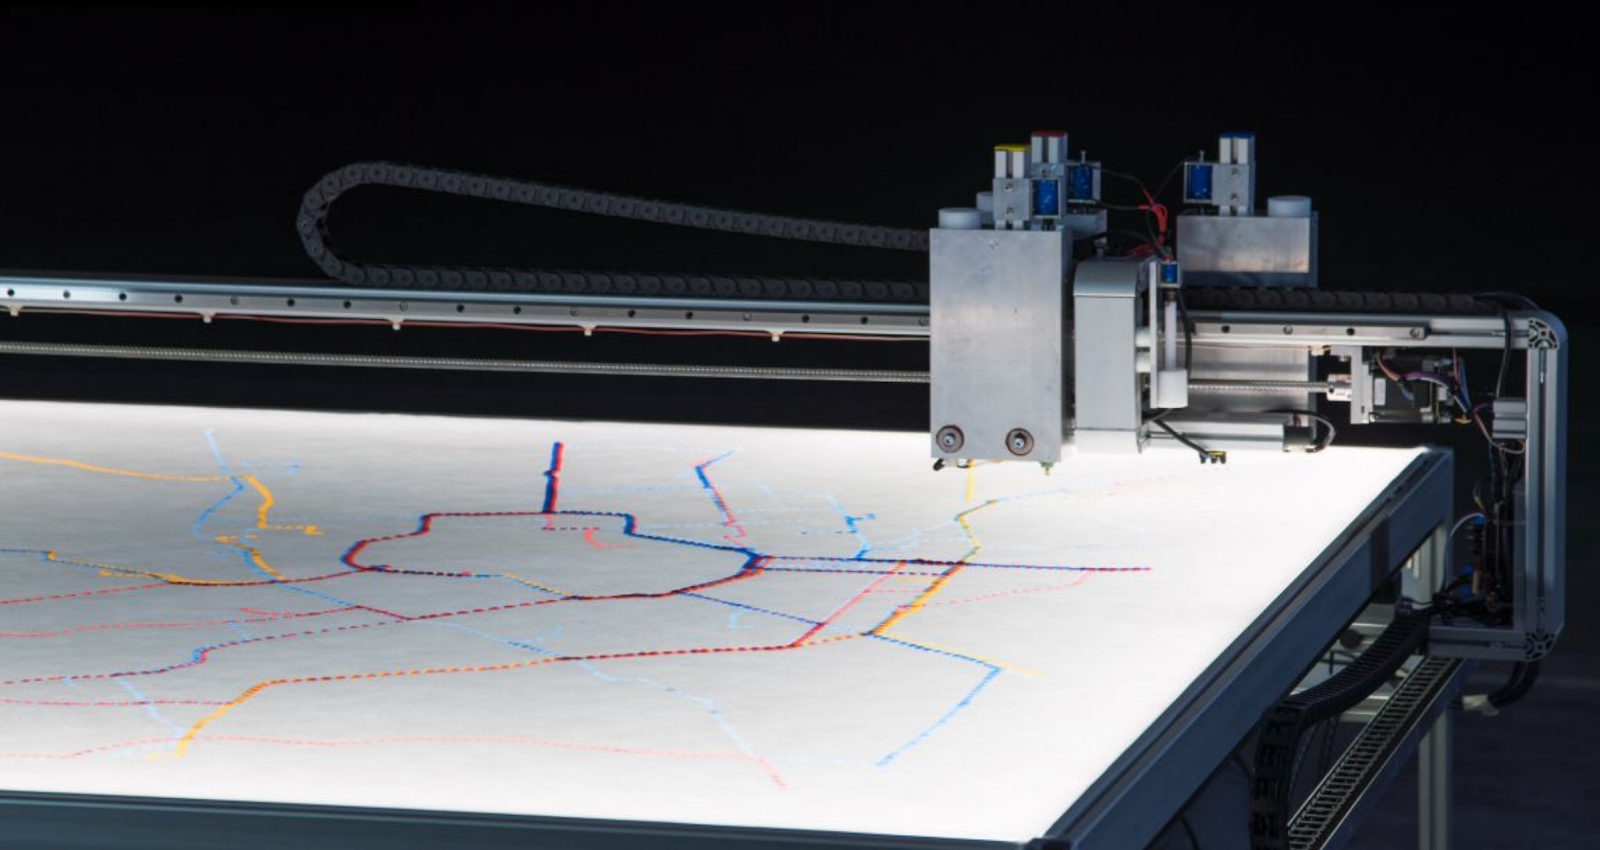
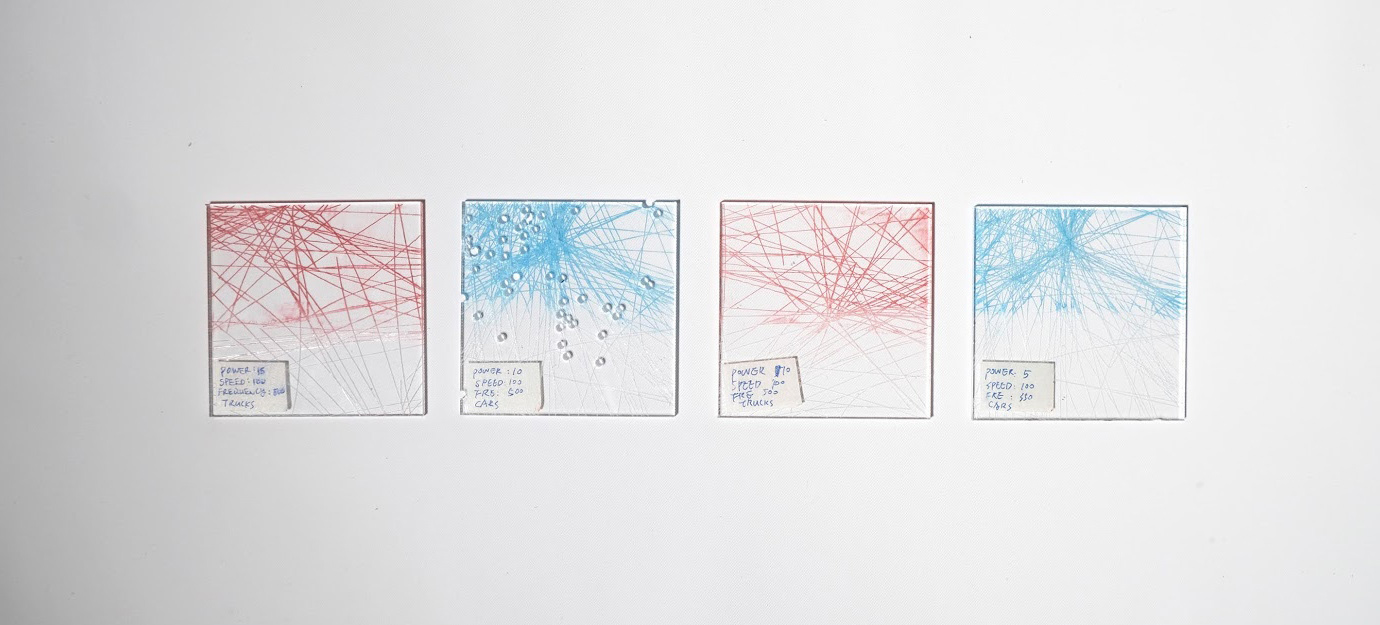
Through the process of testing laser cut settings, we explored many strategies of representing the data, attempting to show pick up and drop off points, playing with line weights of etching, and exploring how to implement more layers of information. We decided that the layer representing the food deserts was information that didn’t correlate well enough with the other data and began to crowd the visuals of the project, resulting in it being removed from the final piece. Another significant conversation that we had dealt with the theory of color and how to assign colors to the different layers of information in a way that didn’t embed subjectivity into the data. For example, using red and blue, like in the tests, would add connotations that the red and blue were meant to signify positive and negative information. We also struggled with our own aesthetic biases with the entire project being predominantly a pristine, white form, which made us gravitate toward abstaining from ink staining the etched lines. Ultimately, we decided to use blue for the truck routes and a teal for the individual “car” routes to portray a more “corporate” identity to the more scheduled rescues and a “freer” identity to the individual rescues.
Through the process of testing laser cut settings, we explored many strategies of representing the data, attempting to show pick up and drop off points, playing with line weights of etching, and exploring how to implement more layers of information. We decided that the layer representing the food deserts was information that didn’t correlate well enough with the other data and began to crowd the visuals of the project, resulting in it being removed from the final piece. Another significant conversation that we had dealt with the theory of color and how to assign colors to the different layers of information in a way that didn’t embed subjectivity into the data. For example, using red and blue, like in the tests, would add connotations that the red and blue were meant to signify positive and negative information. We also struggled with our own aesthetic biases with the entire project being predominantly a pristine, white form, which made us gravitate toward abstaining from ink staining the etched lines. Ultimately, we decided to use blue for the truck routes and a teal for the individual “car” routes to portray a more “corporate” identity to the more scheduled rescues and a “freer” identity to the individual rescues.
Laser Cut Tests
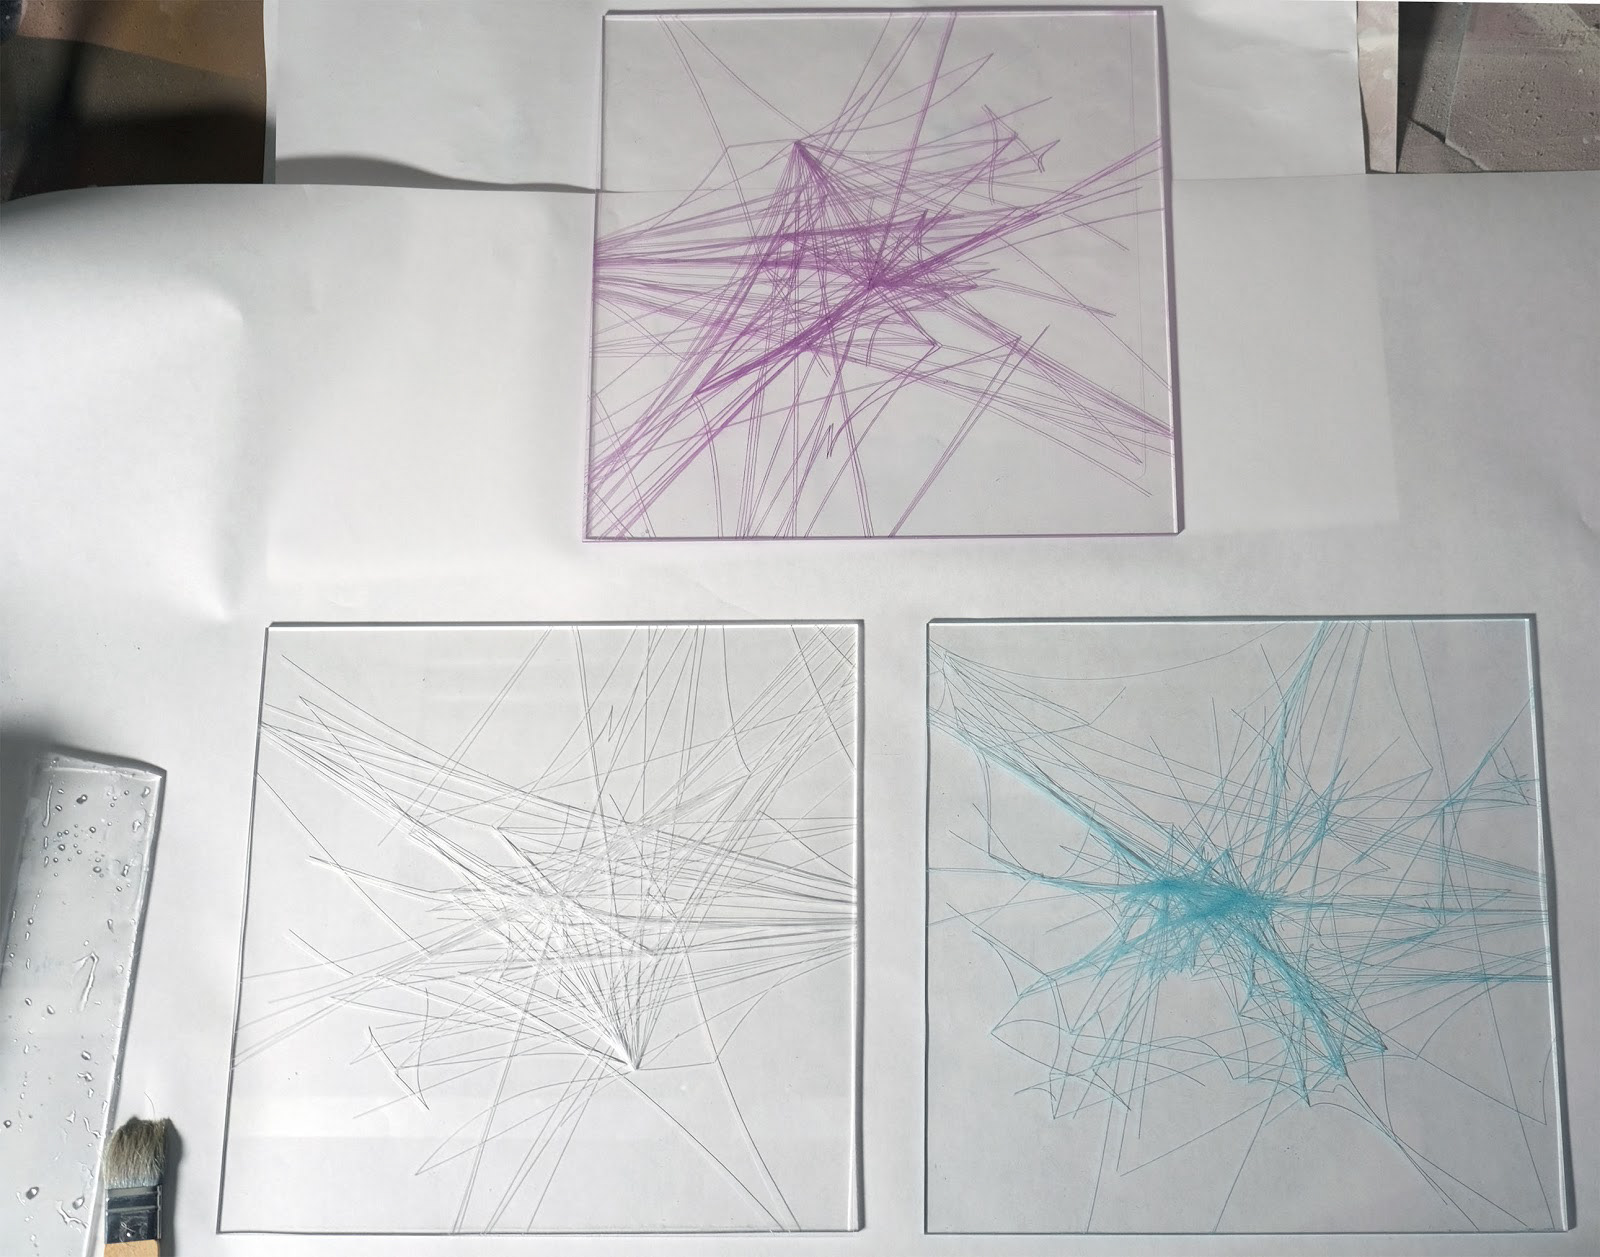
Ink Staining Tests

3D Print Test
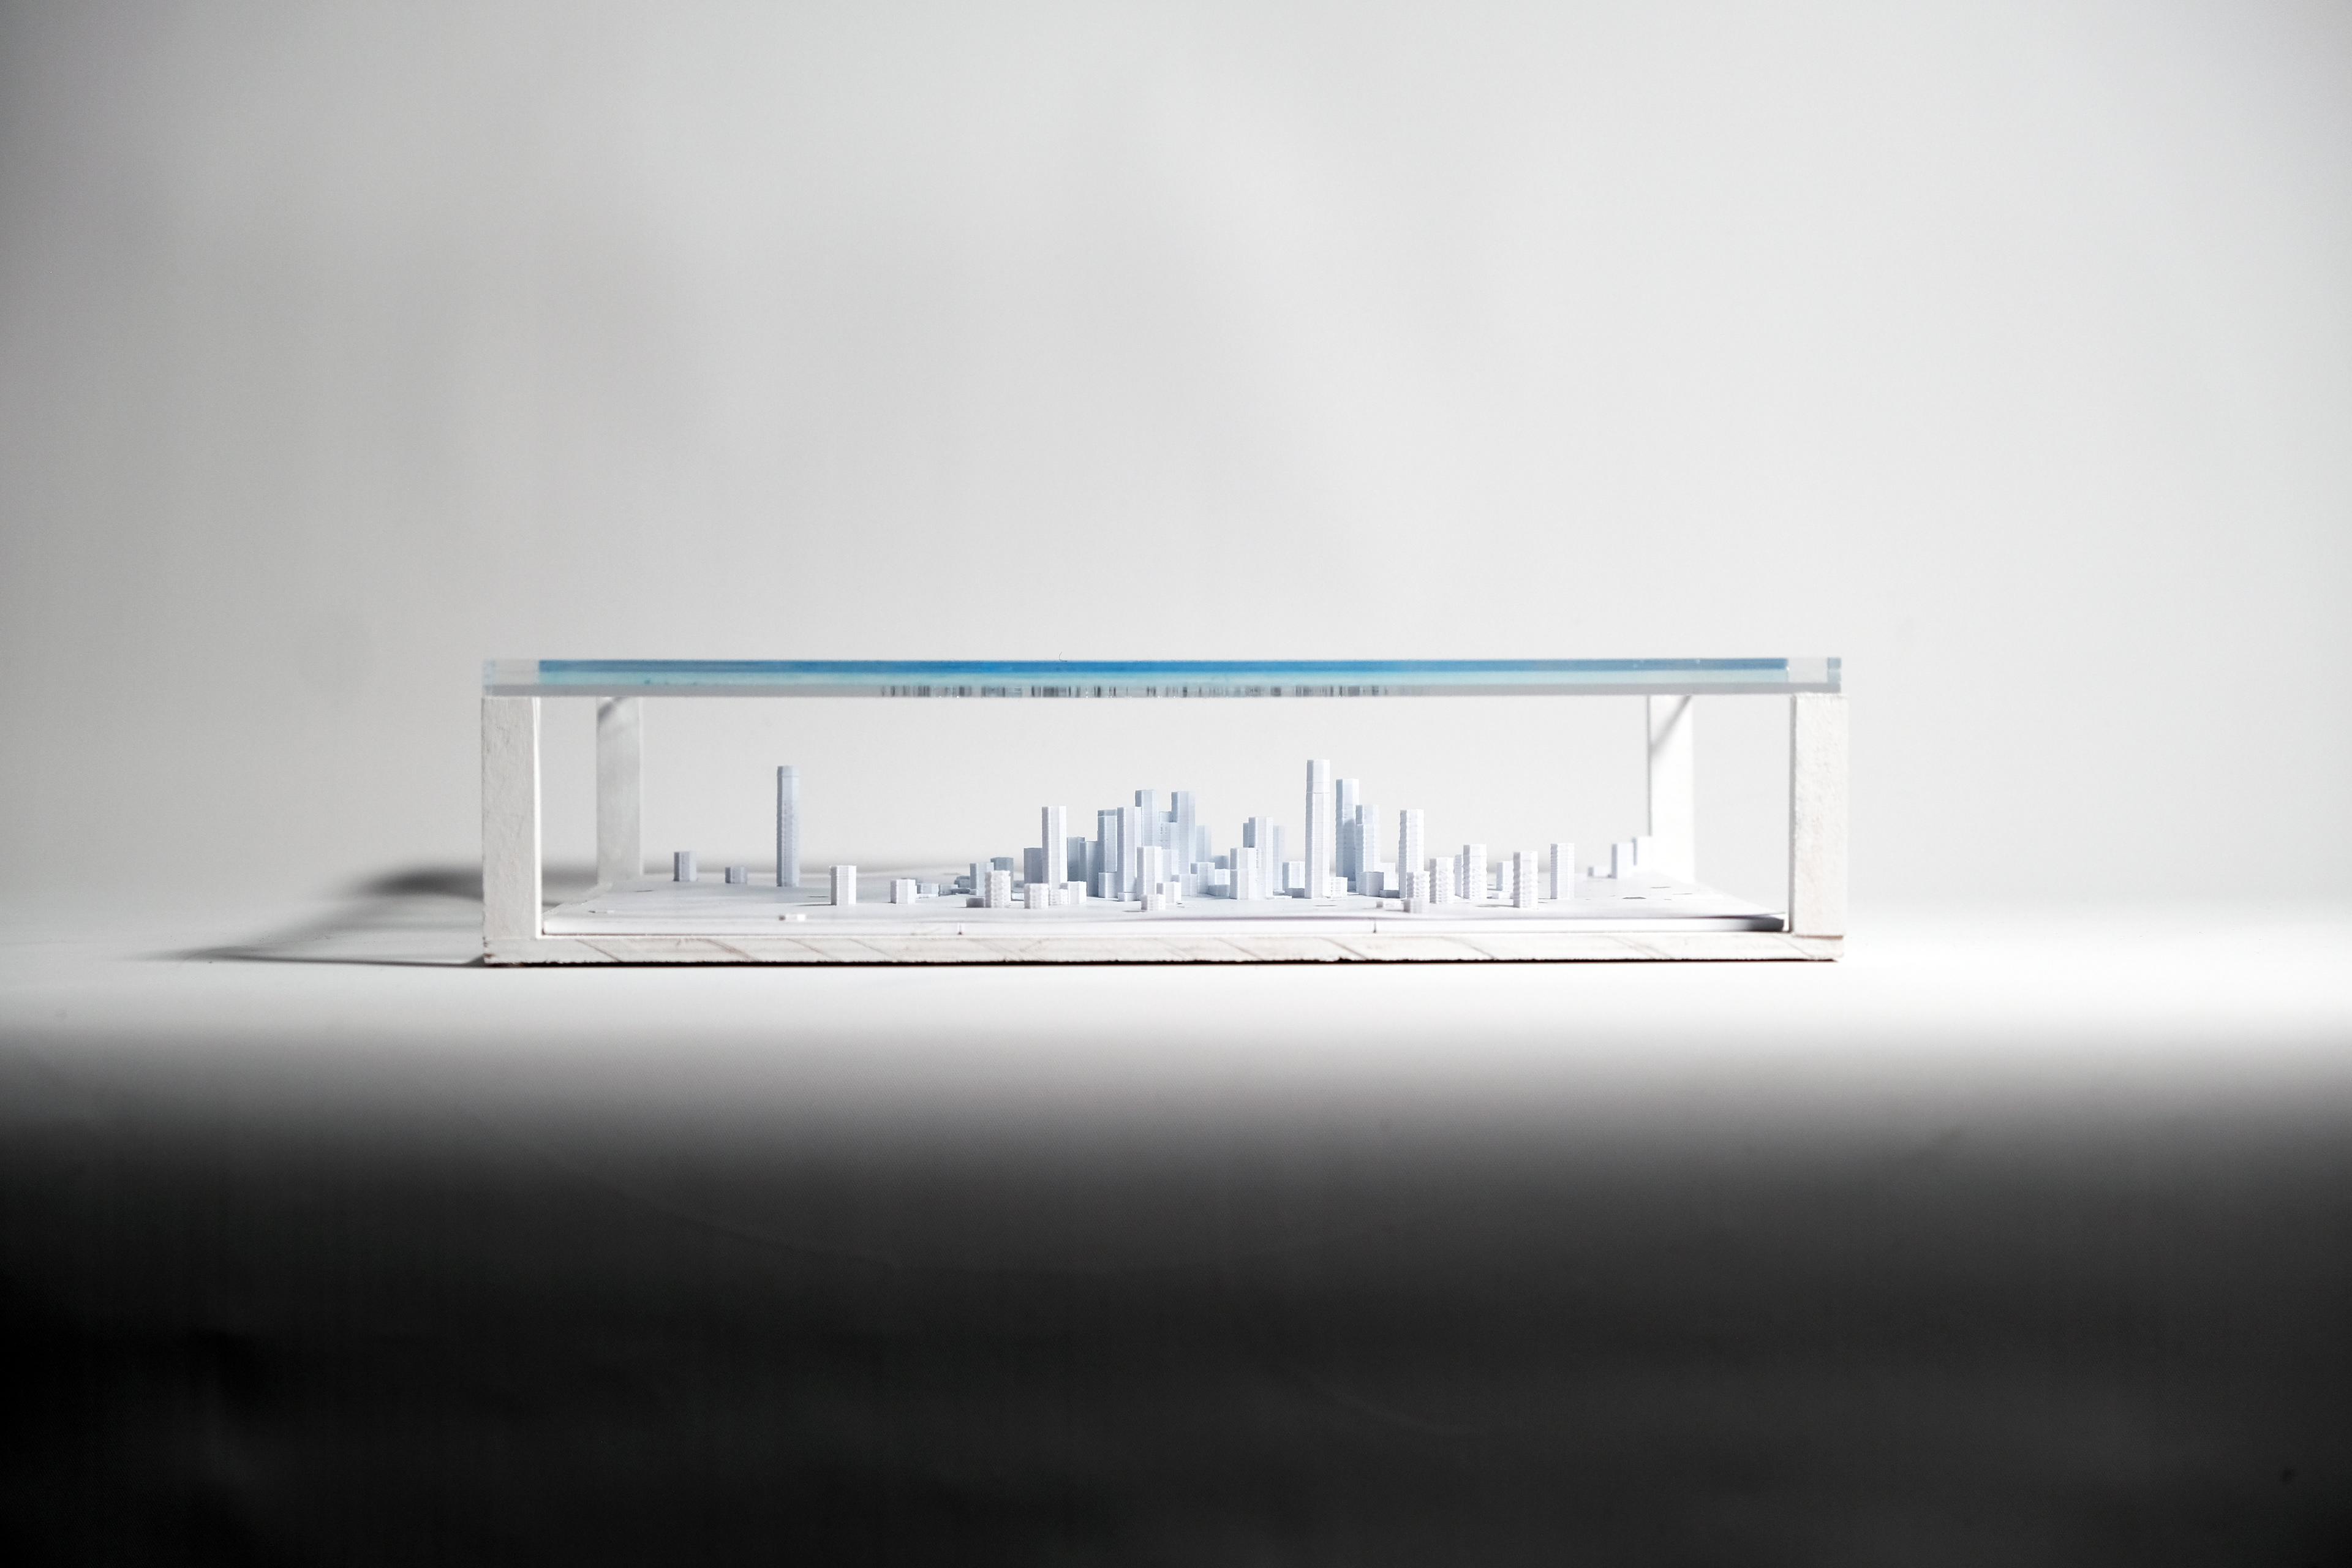
We were also charged with the task of designing a frame, not only to suspend the layers and allow for a physical experience of interacting with the data, but also to give structural integrity and durability to the piece despite its fragility due to the material palette. We iterated through various strategies, working through different details and layering strategies, but landed on a minimalistic design which acted as a table to suspend the Pittsburgh context and route data layers above the 3D printed hex bins. Although simple, we were able to make it rigid and reasonably secure to survive being deployed in 412 Food Rescue events, as is intended for the physical piece.